کد:
http://www.cisco.com/en/US/prod/collateral/contnetw/ps5680/ps6870/white_paper_C11-582242.html
What You Will Learn
Understanding bandwidth traffic and resource consumption is vital to enhanced and proactive network management. The ability to accurately demonstrate WAN optimization is essential to a successful Cisco® Wide Area Application Services (WAAS) proof of concept (PoC).
A successful Cisco WAAS PoC is accomplished in several distinct phases: Planning and Design, Implementation, and Testing and Reporting. While thorough planning and execution of all phases is important, the Testing and Reporting phase is of particular interest, as this is point where the data collected in the PoC is presented to the stakeholders.
An important element of the Testing and Reporting phase is the network monitoring tool that is used to accurately collect and report network activity. Ideally, one week's data should be collected to establish a baseline, followed by another week's data collected after installation and application policy tuning, to see the effect of Cisco WAAS on the WAN.
If a suitable tool is not already in use in the organization, the Paessler PRTG Traffic Grapher is recommended for this purpose, to collect the needed data and to create a valid final report.
About the PRTG Traffic Grapher
The PRTG Traffic Grapher is a Microsoft Windows software tool for monitoring and classifying traffic bandwidth use. It offers a simple, easy-to-learn interface and provides system administrators with live readings and long-term use trends for their network devices. The PRTG Traffic Grapher is most commonly used for bandwidth management, but its sensor technology can also be used to:
• Log the amount of data flowing in and out of Simple Network Management Protocol (SNMP)-enabled network components using the Internet MIB-2 standard
• Inspect all data packets passing a computer's network interface card (packet sniffing)
• Incorporate bandwidth use data sent by Cisco routers using the NetFlow Version 5 protocol
The packet sniffer and NetFlow-based monitoring capabilities of the PRTG Traffic Grapher provide the capability to classify traffic by protocol, IP address, and MAC address.
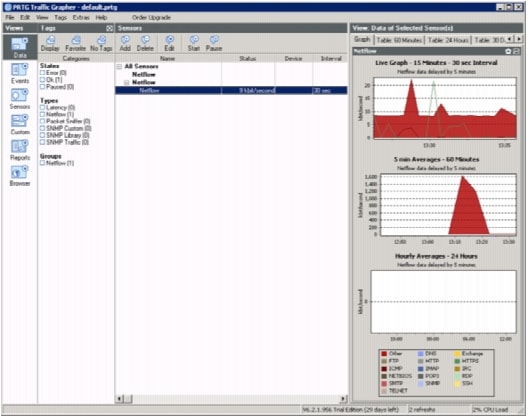
Network and bandwidth monitoring data can be accessed through a Microsoft Windows GUI or through a web-based front end (Figure 1). The intuitive Microsoft Windows user interface provides easy access to data retrieval and configuration functions. In addition, an enhanced integrated web server is available to provide read-only remote access to collected data.
Monitoring results are presented in a variety of graphs and tables:
• Live data for the past 5 to 60 minutes
• 1- to 60-minute averages for up to 48 hours
• Hourly averages for up to 60 days
• Daily averages for up to 365 days
• Top talkers, top protocols, and top connections
Graphs are generated in real time for live reporting. The monitoring engine is capable of monitoring several thousand sensors. The six different live reporting views are:
• Data
• Events
• Sensors
• Custom
• Reports
• Browser
Figure 1. The PRTG Traffic Grapher User Interface
The PRTG Traffic Grapher User Interface
The software is available through various licensing options, for both freeware and commercial use. The freeware edition is free for personal and commercial use, but is limited to monitoring a maximum of 10 sensors (SNMP or packet sniffer-based only). To monitor more than 10 sensors or use NetFlow-based monitoring, a commercial edition must be purchased. Commercial editions offer additional features, which vary by edition:
• Monitoring of more devices and more ports and interfaces
• NetFlow collectors
A full-featured commercial version is available on a trial license for 30 days. Considering the time needed to execute a PoC effort, the 30-day trial is probably sufficient if the PoC installation and tests are timed efficiently. A license can be obtained at
Free trial key for PRTG bandwidth monitoring software.. Note that a commercial version is required to monitor NetFlow traffic.
In a NetFlow environment, the bandwidth use for all packets traversing a router can be monitored. For each flow of data, the router sends a NetFlow packet containing connection and bandwidth information to the monitoring system that is running the PRTG Traffic Grapher. In the PRTG Traffic Grapher, a NetFlow collector is configured to accept these packets and perform the accounting. The advantage of NetFlow is that it requires little additional CPU overhead on the router itself: 10,000 active flows create about a 7 percent additional CPU load; 45,000 active flows account for about a 20 percent additional load. In addition to configuring the monitoring system, you must configure the routers or switches to forward data to the collectors.
Deploying the PRTG Traffic Grapher for a Cisco WAAS Proof of Concept
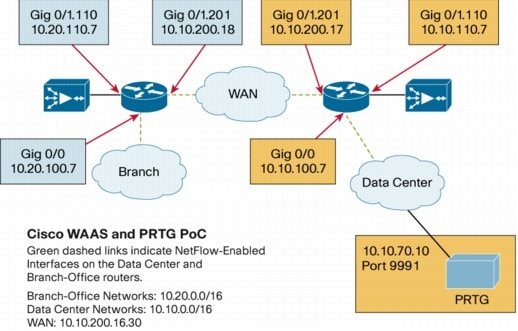
The topology in Figure 2 depicts the deployment of the PRTG Traffic Grapher and NetFlow for a Cisco WAAS PoC.
Figure 2. PoC Lab Topology
Configuring the PRTG Traffic Grapher as a Netflow Collector
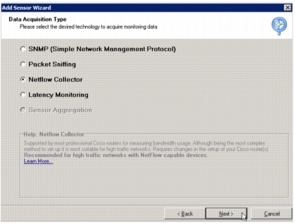
A fully functioning commercial version of the PRTG Traffic Grapher must be installed to use the NetFlow collector. This can be a trial-licensed commercial version. At least one sensor must be created (Figure 3 ) to receive NetFlow traffic from the collectors, which are the routers and switches in the network. Keep in mind that only NetFlow Version 5 is currently supported by the PRTG Traffic Grapher.
Figure 3. Add Sensor Wizard
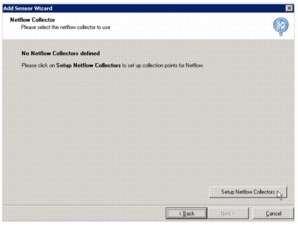
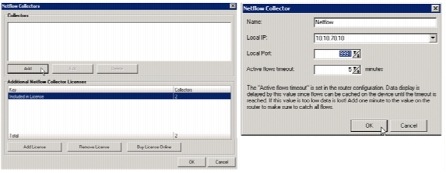
Initially, there are no collectors available for listing on the NetFlow Collectors panel. Click the Setup NetFlow Collectors button (Figure 4) to configure a new collector.
Figure 4. Add Sensor Wizard: NetFlow Collector
In the NetFlow Collector configuration panel (Figure 5), add a name, the IP address of the collector, and a port number. The IP address identifies the workstation on which the PRTG Traffic Grapher is installed, and the port defines the target port to be used by NetFlow for reporting data (local port 9991 in this example). This IP address and port will also be defined in the network router NetFlow configuration, along with the delay time (in minutes) between the reports that are sent to the collector. The delay time is also added here, in the "Active flows timeout" box.
Figure 5. NetFlow Collectors Configuration
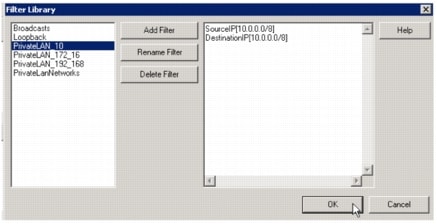
Traffic that is sent to the collector can be filtered. A variety of predefined filters are available, or custom filters can be created, or all traffic can be captured. In this example, PrivateLAN_10 (Figure 6) is selected to filter the 10.x.x.x addresses used in the sample PoC lab.
Select a filter from the Filter Library and then click OK.
Figure 6. Figure 6 Filter Library
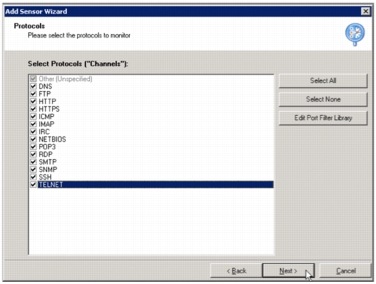
The protocols to be monitored by the NetFlow sensor can be selected (Figure 7), and a scanning interval can be defined. An interval between 10 and 60 seconds is recommended.
Figure 7. Add Sensor Wizard: Protocols
The NetFlow sensor configured in this example can be delegated to a sensor group, if a sensor group has been previously defined.
Configuring Netflow Data Export on Routers or Switches
The next step is to configure the routers or switches that will send statistics to the PRTG Traffic Grapher collector. This task is accomplished in two phases: first with global configuration commands and then with interface-specific commands.
Connect to the router and enter the following commands, to complete the global configuration phase:
dc-rtr# conf t
dc-rtr(config)# ip flow-export version 5
dc-rtr(config)# ip flow-cache timeout active 5
dc-rtr(config)# ip flow-cache timeout inactive 10
dc-rtr(config)# ip flow-export destination 10.10.70.10 9991
dc-rtr(config)# end
Note: 10.10.70.10 is the IP for the collector; 9991 is the port.
Examine the available interfaces and make an appropriate selection:
dc-rtr# show ip interface brief
Interface IP-Address OK? Method Status Protocol
GigabitEthernet0/0 10.10.100.7 YES manual up up
GigabitEthernet0/1 unassigned YES NVRAM up up
GigabitEthernet0/1.110 10.10.110.7 YES manual up up
GigabitEthernet0/1.201 10.10.200.17 YES manual up up
In this example, Gig 0/0 and Gig 0/1.201 are selected for interface-specific designations:
dc-rtr# conf t
dc-rtr(config)# interface gigabitEthernet 0/0
dc-rtr(config-if)# ip flow ingress
dc-rtr(config-if)# ip flow egress
dc-rtr(config-if)# exit
dc-rtr(config)# int gigabitEthernet 0/1.201
dc-rtr(config-if)# ip flow ingress
dc-rtr(config-if)# ip flow egress
dc-rtr(config-if)# end
dc-rtr# write memory
dc-rtr#
Complete these steps for both the branch-office and data center routers and remember to save the configuration.
Using PRTG Traffic Grapher Reports
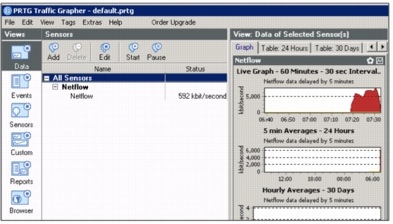
Return to the main PRTG Traffic Grapher screen ( Figure 8) to view the completed sensor definition, and view the initial output from the NetFlow collector.
Figure 8. PRTG Traffic Grapher NetFlow Collector
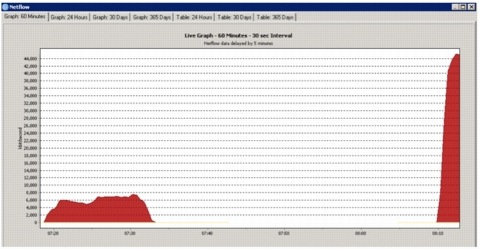
Figure 9 shows the PRTG Traffic Grapher analysis that resulted from the execution of the Microsoft Exchange LoadSim tool. The load graph on the left shows the nonoptimized performance of this application. The spike on the right represents the optimized performance of this same application. The notable increase in throughput is the result of the compression, transport optimization, and MAPI optimization of the Cisco WAAS Wide Area Application Engines (WAEs). This PRTG Traffic Grapher graph shows a 600 to 700 percent throughput increase when Microsoft Exchange LoadSim is run optimized instead of nonoptimized.
Figure 9. Microsoft Exchange LoadSim Analysis
A variety of graphical depictions can be viewed in the main window of the PRTG Traffic Grapher tool, and each depiction can be exported to report files. Configurable reports (graphs and data tables) can be exported in HTML, Microsoft Excel, TIFF, RTF, and Adobe PDF formats. Daily, monthly, and yearly reports can be exported through email or saved to a file. Filters can be applied to create reports by x% percentile calculation for any percentile value, for any interval, and for any time frame.
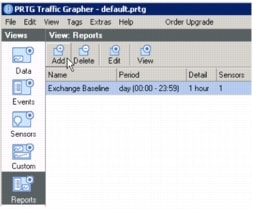
To add a report, choose Reports > Add from the PRTG Traffic Grapher panel (Figure 10).
Figure 10. Adding a Report
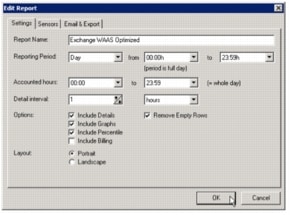
Name the report and select the appropriate parameters for your PoC (Figure 11).
Figure 11. Report Name and Options
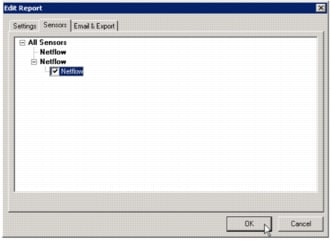
Select the NetFlow sensor (Figure 12).
Figure 12. Selecting Report Sensor
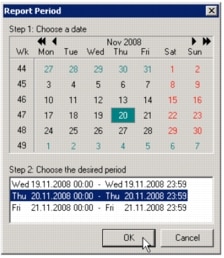
Select a date and time range (Figure 13).
Figure 13. Selecting Report Time Range
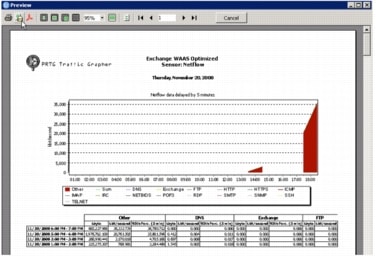
View the final report (Figure 14). The export icon in the menu bar allows you to export the report in a format suitable for your PoC presentation.
Figure 14. PRTG Traffic Grapher Final Report Sample
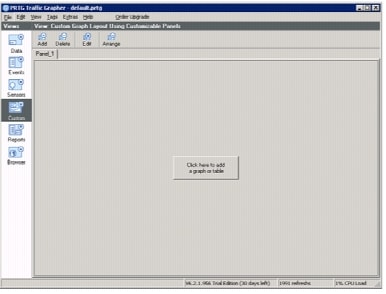
Custom graphs are another useful feature of the PRTG Traffic Grapher. To create a custom graph, click the Custom button on the PRTG Traffic Grapher panel (Figure 15) and then click the "Click here to add a graph or table" button.
Figure 15. Creating a Custom Graph
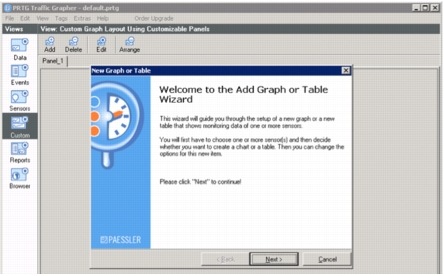
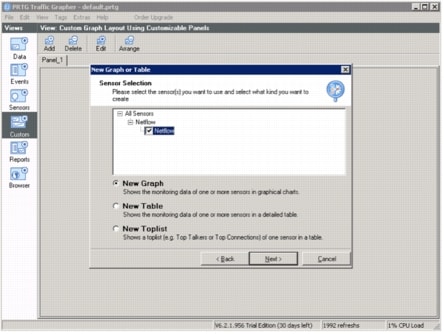
Click Next (Figure 16) and follow the instructions provided by the Add Graph or Table Wizard.
Figure 16. Add Graph or Table Wizard
Select the options desired (Figure 17). In this case, select a new graph based on the NetFlow sensor.
Figure 17. Custom Graph Selection
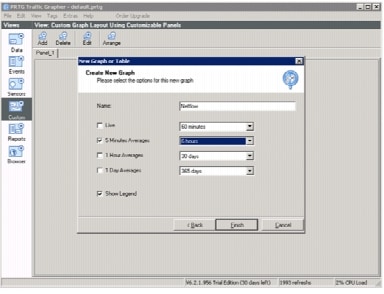
Select the graphs desired (Figure 18). In this case, select one graph to report the results of three Microsoft Exchange LoadSim simulation runs.
Figure 18. Custom Graph Options
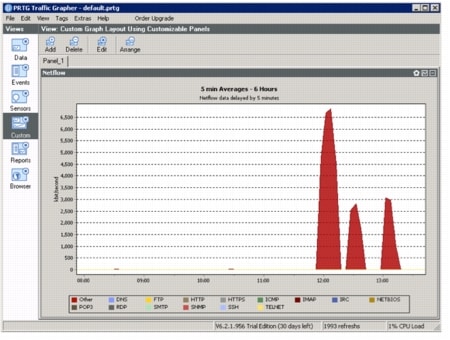
The resulting custom graph is displayed in Figure 19. The first run in this graph shows the results of the first Microsoft Exchange LoadSim run, with optimization disabled. The second and third runs show the effect of the warm cache as less traffic traverses the WAN.
Figure 19. Custom Graph Results
Conclusion
Gathering accurate baseline measurements and then effectively demonstrating WAN optimization with Cisco WAAS is essential to a successful Cisco WAAS PoC. If suitable monitoring and reporting tools do not exist in the customer's PoC environment, the Paessler
PRTG Traffic Grapher is recommended for this purpose. This tool can be successfully deployed to obtain the before and after measurements required to demonstrate the benefits of WAN optimization with Cisco WAAS. This versatile tool can also be used to present the results of the optimization demonstration in a variety of effective formats to meet the success criteria of the Cisco WAAS PoC.

 LinkBack URL
 About LinkBacks