
سلام جناب راستی، بنده هم بار اول که این تصویر رو دیدم خوب متوجه نشدم
این نقشه همان BGP routing data است (آدرسهای اختصاص یافته به شبکه های مختلف متصل به اینترنت که توسط روترها برای بهینه کردن روتینگ استفاده میشود..autonomous systems) که توسط منحنی هیلبرت مرتبه 12 نگاشت شده!
این تصویر رو ببینید شاید بهتر متوجه بشید:
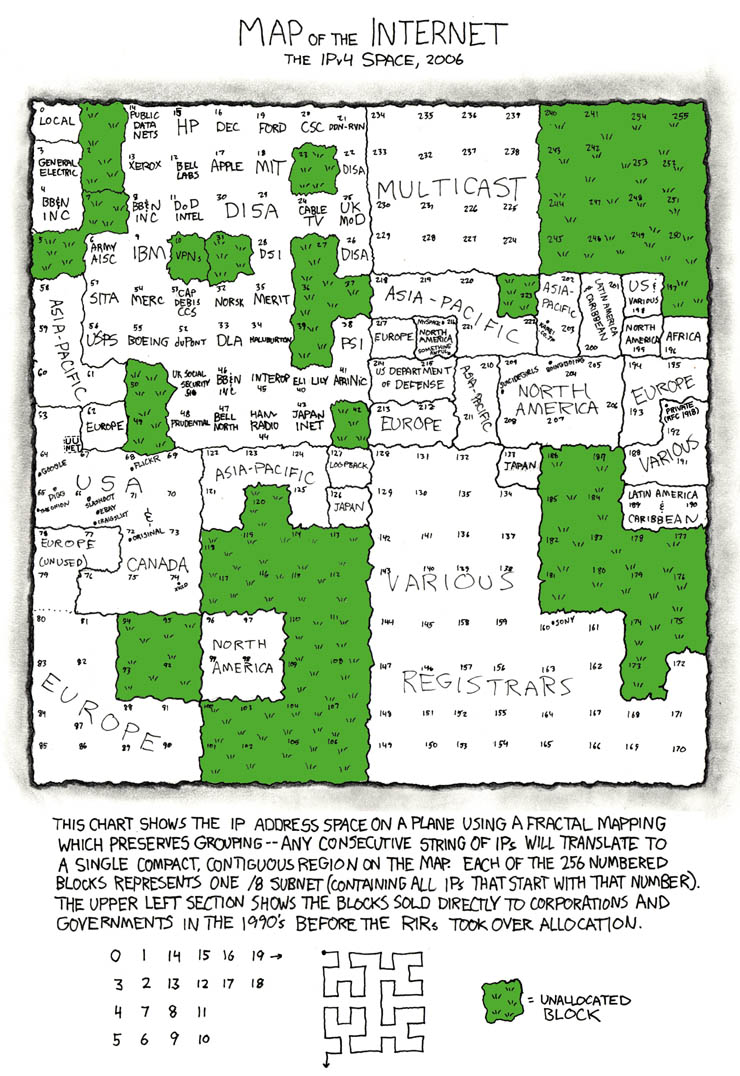
این تصویر نشان میدهد که آدرسهای اینترنتی چگونه بین شبکه های مختلف پخش شده
نقشه قبلی هم مشابه همین نقشه است با این تفاوت که جزئیات بیشتری را نشان میدهد و براساس اندازه هر شبکه (CIDR) رنگی به آن اختصاص داده
هر پیکسل نقشه هم نمایانگر یک شبکه با نت مسک 255.255.255.0 است
This image shows a visualization of BGP routing data taken from the Routeviews project. Here, 1-dimensional IPv4 address space is mapped into a 2-dimensional image using a 12th order Hilbert curve, as inspired by xkcd. This means that CIDR netblocks always appear as squares or rectangles in the image.


Address blocks are labeled based on IANA's list of IPv4 allocations. Early recipients of large "class A" address blocks appear in the upper left, while the areas labeled Various Registries indicate allocations from the former "class B" and "class C" regions. Since the mid-1990's all address space allocations are now made through the Regional Internet Registries: RIPE, APNIC, ARIN, LACNIC, and AfriNIC.
Each pixel in the original 4096 x 4096 image represents a single /24 network containing up to 256 hosts. The pixel color shows the size of the route advertisement covering that space ranging from /8 (purple) to /32 (red). Black represents space without a route and grey indicates reserved space. Prefixes are rendered in order from largest to smallest so that larger (covering) prefixes can be seen underneath the smaller (more specific) announcements.
توضیحات کامل رو میتونید در آدرس http://maps.measurement-factory.com/gallery/Routeviews/ مطالعه کنید. چندتا انیمیشن هم داره که باید جالب باشه(خودم البته ندیدم)

 4سپاس
4سپاس LinkBack URL
 About LinkBacks


